The conflict in the Ukraine is roiling the stock market, tempting many investors to flee to safer assets. We provide some historical context for market selloffs and recoveries–which have occurred with some frequency–and caution investors against making sudden moves that could disrupt their long-term financial plans.
Stocks have historically bounced back from lows, rewarding patient investors.
Looking at the long-term history of the market can help you keep in perspective the cyclical nature of these types of events.
The S&P 500 Stock Index returned nearly 79% from 2017 to 2021. But there were periods when markets declined substantially. An investor who stayed put would have recovered from each of those pullbacks, while an investor who sold could have locked in losses.
Volatility Does Not Equal a Financial Loss Unless You Sell
Chart shows closing prices for the S&P 500 Stock Index from December 31, 2017 through December 31, 2021. Shaded areas indicate market selloff.
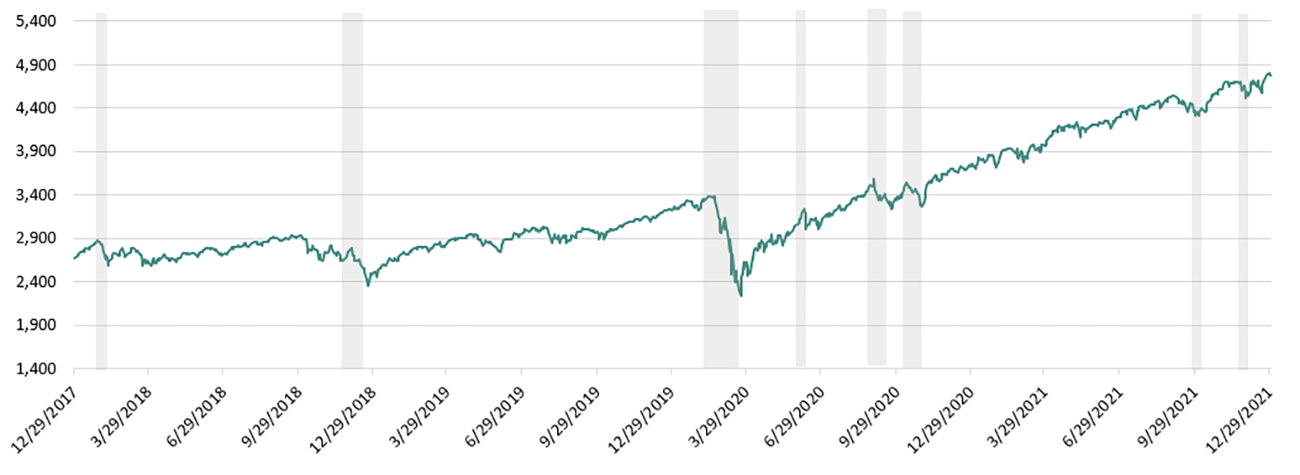
Source: Yahoo! Finance. The Standard & Poor’s 500 Stock Index is a broad-based measure of U.S. stock market performance and includes 500 widely held common stocks. Indices are unmanaged and investors cannot invest directly in an index. Unless otherwise noted, performance of indices does not account for any fees, commissions or other expenses that would be incurred. Returns include reinvested dividends.
Market timing is perilous. Even if you’re lucky enough to avoid a dip, you might not be lucky enough to get back in before a rebound. And you need to be in the market to benefit from any potential recovery.
Your emotions usually lead to poor decision-making for your long-term financial health. It’s time IN the market, not timing the market that has the potential to reward investors over the long haul.
Stocks go up and down every day, but history shows the chance of incurring a loss in your stock investment declines the longer you remain invested. The graph below shows the cumulative stock market returns with and without the best days in the market.
Cumulative Stock Market Return With and Without Best Days
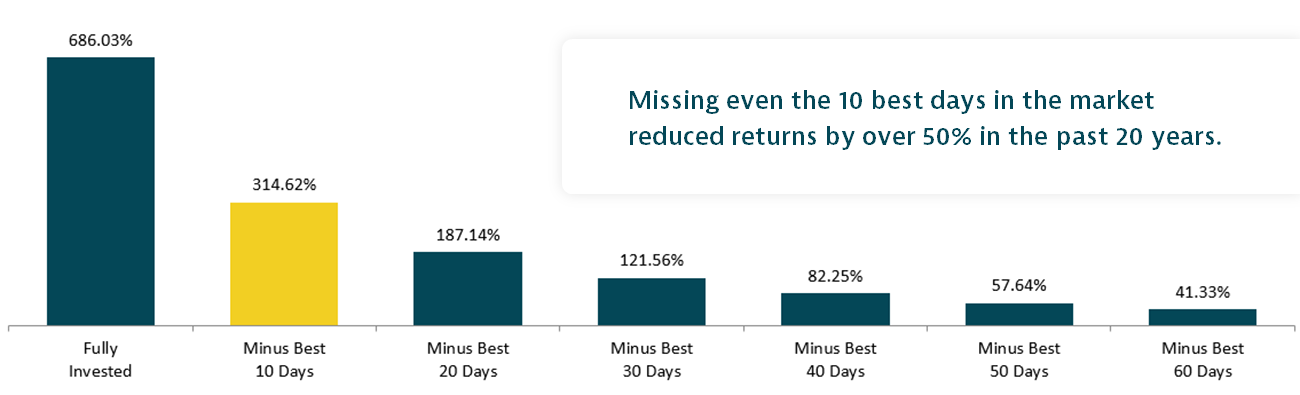
Chart shows the cumulative total returns, which includes the reinvestment of dividends and capital gains, for the S&P 500 Stock Index for the period January 2, 2002, through December 31, 2022, and cumulative returns for that same time period minus best days as measured by historical price data. This chart is for educational purposes only to demonstrate the effects of market timing. It is not a promise of any investment’s future returns. Past performance does not guarantee future results.
Time can help mitigate the risk of risky assets. Over long time periods there are few times in history where an investor suffered a loss based on rolling returns.
Stocks tend to be more volatile than other asset categories, but history shows the chance of incurring a loss declines the longer you remain invested. This analysis divides the last 65 years of returns for the S&P 500 Stock Index into holding periods of various durations. As you can see, there was no 15-year holding period that resulted in a loss during this time period.
The Benefit of Time In the Market
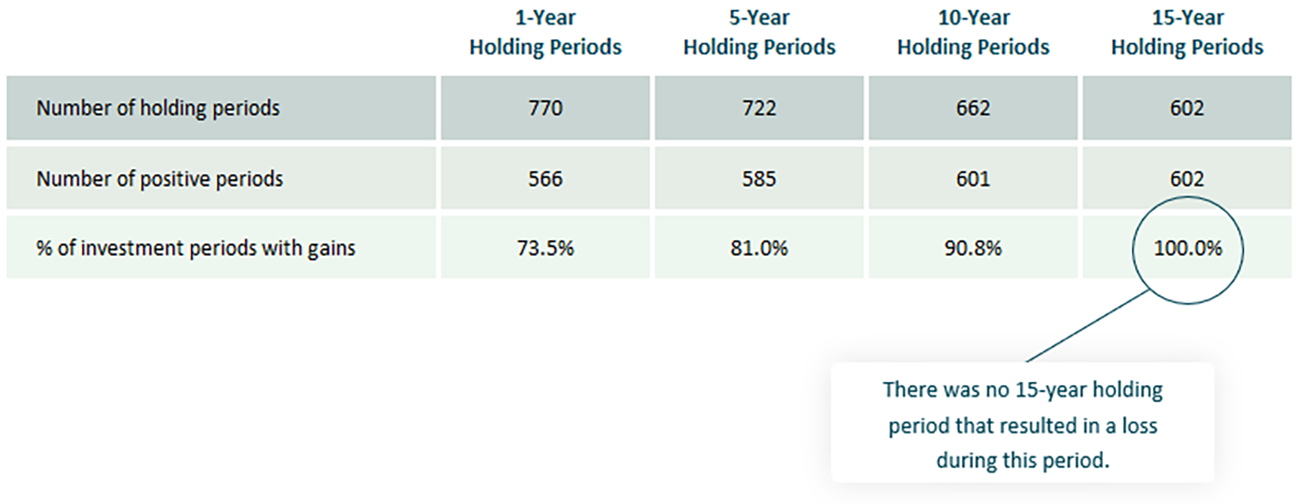
Chart shows the number and percentage of rolling investment periods with positive returns based on historical monthly returns for the S&P 500 Stock Index for the period December 30, 1956 through December 31, 2021.
Patience is a virtue. For investors, being patient can help you avoid locking in a loss.
Riding out periods of market volatility can be challenging, but history shows that time gives your portfolio a chance to recover its value. Our financial professionals are available to talk to you about your current investment strategy. Give us a call at 800.258.3030, option 2.